|
Early Well Data Compilations
Copious amounts of data were acquired on these wells. In the early days, the only way to synthesize these data was by drafting it all onto a large format. These were aptly named “bedsheets” as they were very nearly the size of a twin bed sheet by the time they were compiled. St. George COST No. 2 (1982) was the first one I worked; by the time the COST test offshore California was worked, geochemistry had become a bigger part of the story, and the compilation and well ties to seismic helped us to recognize that basement was deeper than previously interpreted, that Franciscan-derived debris had been mistaken for Franciscan basement, and there was the previously unappreciated potential for hydrocarbon maturation.
Between the time I worked the Pacific and Frontier regions and the COST tests on the Atlantic shelf, I spent some time at work onshore in the Williston Basin. There, I dreamed of annotated well logs. Rather, each new copy of a field or final well log at that time came off a mimeo type machine. So the logs were printed on “slimy” paper, any earlier work had to be copied onto it, and it was a continuous roll which was best suited for hanging cross sections. Pre-folded paper was a thing of the future.
Annotated logs are a whole separate discussion. At one company in the early 90’s, we had a lovely on-floor file room for well results, but each data type was filed separately in folders or notebooks: paper copy log, petrophysics, geochemistry, biostratigraphy, etc. I instituted the preparation of hand-annotated log copies using standardized colors, symbols and annotations. These were then available to all and pre-folds could be copied. At the same time, I trained six people in the use of the well-to-seismic tie software DLPS (Digital Log Processing System?) affectionately referred to as “doglips.” The team eventually processed an average of up to 125 vertical wells with paleo each, 600 in all, across the Gulf of Mexico. These wells were tied to sixteen west-to-east, and four south-to-north seismic transects in an effort to accelerate the level of basin knowledge among the staff and to prepare for future lease sales. No copy or recollection of the format of these displays remains in my possession.
At my next company, a reentrant into the Deepwater GOM, now in the mid to late 90’s, hardcopy logs were to be found only in a few individuals’ offices; many others were found stored in a closet after one guy had left. These were collected and committed to a lateral filing cabinet system wherein all of the information for a given well was contained in a labeled expanding folder that could then be checked out. The help of administrative staff and my drive to see it done made this paradigm transformation possible in a relatively short time. This system accomplished several things: for the first time we knew what we had, the material could be accessed in a hurry for a prospect or opportunity evaluation, and in the event a second party needed the same material, they would know who had it to borrow or make copies.
The Digital Era Presaged
The Baltimore Canyon wells B-2 and B-3 were the first deep stratigraphic tests on the Mid-Atlantic outer continental shelf. The former was drilled by Ocean Production Company from December 1975 to March of 1976, and the latter drilled by Chevron USA, Inc. from October 1978 to March 1979. The latter was also an early deepwater well as it was drilled in 2686 feet of water. These wells were drilled for a group of companies to help evaluate the petroleum systems of offshore areas before bids were submitted in lease sales. Reports on these wells ran to more than 100 pages and contained information on geology, lithology, bistratigraphy, geothermal gradients, organic geochemistry, geophysics, and petroleum potential.
By the time I worked these wells in the early 80’s, interest in the play potential had cooled, but there was still much to learn about the size and situation of subtle elements of the basin fill such as nanno oozes, oolite shoals, and rudistid reefs, as well as to the rather dramatic Jurassic reef edge and its potential for deepwater clastic aprons. Moreover, this work synthesized a great deal of information that was in danger of being lost.
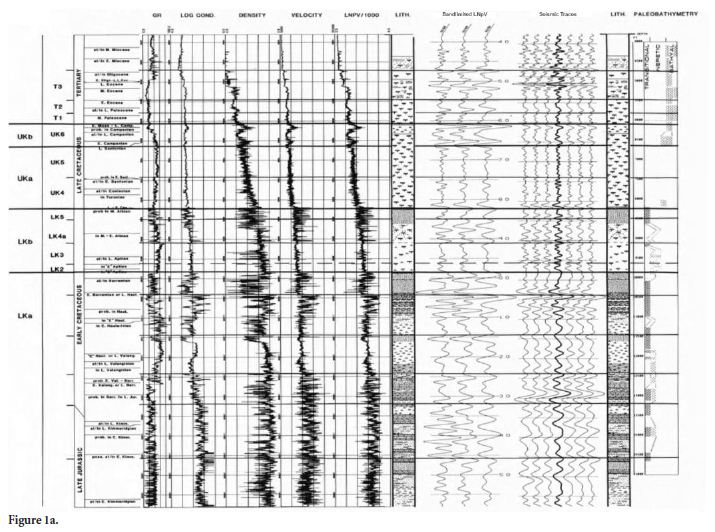
To summarize these wells, part digital-part drafted elements were assembled in an early composite log display, the first I had produced since the bedsheet days. More importantly, these displays were meant to bridge the gap between geology and geophysics for the dual purpose of well to seismic calibration in lateral prediction and to advance basin knowledge.
An example is shown in Figures 1a and 1b was compiled by me and rendered by a draftsman. The log suite, synthetic, and seismic traces are output from individual digital sources at the same time scale were first compiled in drafting. Biostratigraphic, sequence stratigraphic, lithologic, and paleobathymetric data were added later, sketched and then drafted to scale.
Digital Drilled Well Composites
Finally in 2005, I had the golden opportunity to design for my company a completely digital composite log display. Having carfted a similar display during a short consult using fabulous PC-based HDS software, I knew what I wanted to do when I collaborated in London with a Geolog consultant to interactively realize my concept along with key recommendations in a Linux-based display. As a living document, developments continued with use and a second, Houston-based, Geolog consultant in 2006. Ultimately, the tool was turned over to our growing petrophysical community for routine utilization and safekeeping. The final element of my original design fell into place in October 2010.

Currently we co-display the following information (Figure 2): Recorded: Measured depth (left scale), chronostratigraphy, relative bulk volumes of shales, reservoir sands, and fluids; mineral log, image logs, caliper, gamma ray log, resistivity log, sonic log, density log; Interpreted: Biostratigraphy and bathymetry, sequence boundaries, lithologic tops and bases; Computed: Acoustic impedance curve and well synthetic curve, sand flag based on porosity, saturation, formation pressure, pore pressure, permeability, nuclear magnetic resonance, TVDss depth (right scale).
I have seen plenty of other companies’ petrophysicists use this software for their own purposes. The universal applicability of this tool was first successfully tested on a reservoir engineer! This display was not only designed to be a documentation of sands and shale properties, but to be a communication basis to give all disciplines a common access to learnings and ready basin knowledge.
Proposed Well Composites
There is another kind of composite display that is important to consider. First brought to my attention in the late 80’s while I worked Brazil it was called a “perfil composito” in Portuguese. These were used to document well proposals and prognoses. At the time we constructed them, then had them drafted, in an 8 ½ by 11” pre-folded page format, regardless of the elements such as seismic lines. The first page as I recall was an area map, followed by a justification for the well, type and/or prognosis log, key seismic lines, etc.
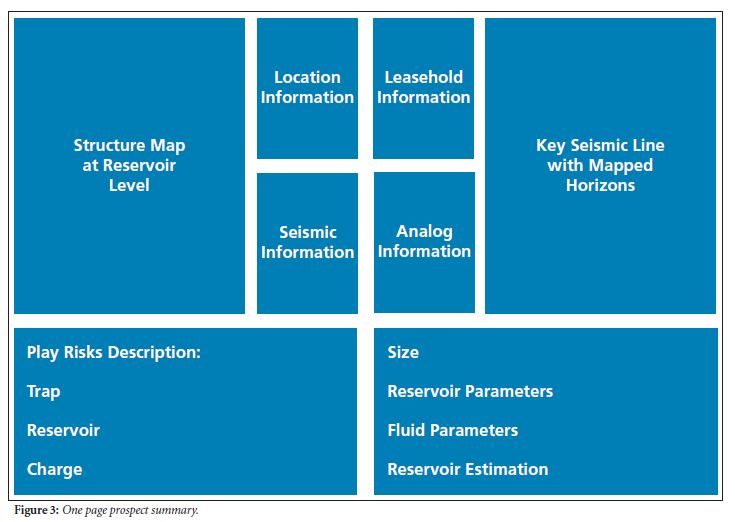
Today we have PowerPoint presentations to take the place of drafted copy and that is a good thing. Our proposals are now summarized occasionally on one page for management’s convenience (Figure 3). We simply have to take care that we do not lose the ability to write and to compile a compelling, unbiased, justification presentation for a well.
|
 Tools of the Trade