Semantics and Seismic Stratigraphy
A colleague recently demonstrated a propensity to use the word “productive” when he referred to hydrocarbon-bearing sands, none of which have been produced. The concern was that our management audience might attach more importance to the observations than was warranted. Neither is all that is resistive on logs necessarily pay; it may be tight marl, an ash bed, or even pressured shales. Words are very powerful, can be subliminal, and may send a listener off on a mental tangent. A bit of care and precision is often advisable. When complex concepts are under di s cus s ion, of ten s impl e and descriptive terms are easiest to grasp. With regard to seismic stratigraphy, some practitioners are industry trained rather than book learned. My first industry job was a summer internship at Shell’s Bellaire Research Center wherein my project, in 1975, was to explain what Vail et al.’s long abstract, a predecessor to the famous book on Sequence Stratigraphy (1977), was about. Participation in Shell’s first Seismic Stratigraphy Workshop (1978) and then in its second in 1984, laid the groundwork for my career. I recall that I was only repeat attendee/contributor; the first was attended mainly by exploration stratigraphers, and the second mainly by research geophysicists.
|
|
This ultimately led to involvement in training at Shell, Marathon, and Vastar in Structure and Basin Evaluation, and to an interest in how people learn. This exposure led to opportunities to influence a succession of managers regarding accommodation space, lateral prediction accuracy, and reservoir detection on seismic. Eventually, I also realized that if there were say ten sequential observations in a particular area of study, some people may be able to recognize and describe seven of them and others only three. The ability to perceive subtle differences to decode the spatial and temporal distribution of deposition and deformation events varies with the individual. It cannot be presumed to be a present or even acquirable skill for every geoscientist. Some may have innate skill, practice can hone the skill; however, some do not have the knack and may only be able to appreciate it.
One training set was designed to help a hand–picked team to learn to calibrate proximal to distal facies and faunal changes in a basin. One of my managers thought that there was nothing to this seismic stratigraphy / lateral prediction stuff so he borrowed this well calibration training set developed from the classic West Cameron shelf to slope setting and gave it to his “favorite” geologist. The manager inadvertently, and rather neatly, proved my point when the fellow returned the sections and, instead of showing progradation from landward to seaward, he had backfilled the section seaward to landward. Would not have believed it if I had not seen it with my own eyes.
Another gem captured for training purposes is the one shown in Figure 1 of a minibasin from Garden Banks. Minibasins are by definition those small basins that form entirely within canopied salt. They largely contain Pliocene and younger in situ sedimentation, the oldest of which sets the upper boundary for the age of the arrival of the canopy — lower Pliocene in northeast GC and upper Pliocene in KC for example. Any and all Miocene and older material and fauna are reworked. Incidentally, the base of these basins should not “sag” beneath the base of the salt canopy. Check your velocities if they do.
The example minibasin is filled with upper Pliocene and Pleistocene sediments. This example shows the use of some simple, descriptive nomenclature. I have never been fond of codes for either faunal markers or for sequence stratigraphic elements, as I think they have formed a culture of “haves” and “have nots” as to the understanding of basin architecture and the ability to appreciate the systematic way in which basins are developed and preserved.
Here is a simple way to unlock the clues to a basin’s development. First of all, gross packages of the basin’s fill can be identified that are genetic and representative of the basin phases of development (Figure 1a). This is an indicator of every time the basin changed shape due to salt evacuation. The boundaries are identified by discordance of both geometry / alignment and of facies.
I am still waiting to get my hands on software that would allow this work to be done / shown easily in three dimensions. In the meantime, I have graduated from colored pencils on paper to PowerPoint. I still hand color sometimes when I am in a hurry to capture a first impression or when I want to go portable or be “hands on”.
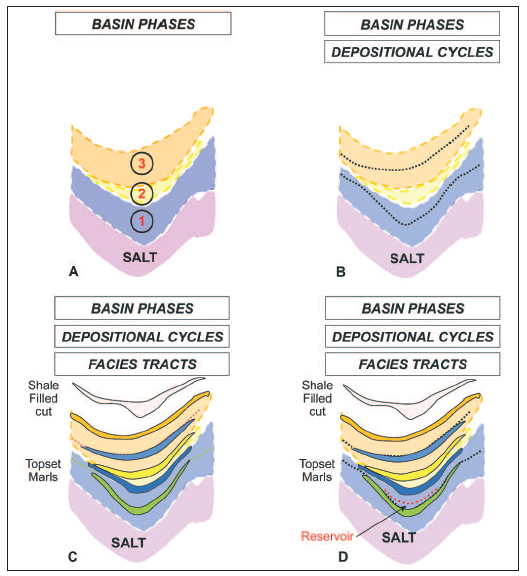
Basin phases 1 and 3 in this example (Figure 1b) have more than one depositional cycle in the fill as indicated by the dotted black lines. Each of the five depositional cycles is capped with a marl facies tract which indicates that the clastic “machine” shut off episodically (Figure 1c). Only the second depositional cycle of the first basin phase shows evidence of coarser clastics in a basin floor fan setting (Figure 1d). A younger shale cut and fill cycle is shown in the Pleistocene.
I particularly eschewed the practice of what I called “seismo-facies” description using amplitude and continuity etc. characteristics instead of calibration and lateral prediction from well control.
Over the years, some reservoir characterization framework methodologies were developed for projects and for training, and the search for effective ways to communicate the steps in the process began. A simple pyramidal image seemed logical to me at one time to describe the process (Figure 2). The inspiration for this was the “funneling” process we used in recruitment, to start out with broad simple questions and then to home in on key questions that would display desired traits.
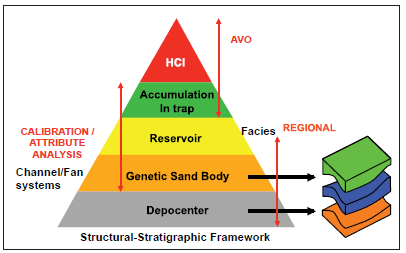 Too often I observed analyses that skipped key steps or observations that were absolutely necessary to anchor an interpretation. Some groups failed to do the necessary regional and sub-regional work to become familiar with a trend. Some groups did not routinely calibrate well data to seismic at the genetic level to learn where the potential reservoirs “lived” or how they were distributed laterally and/or downdip. Mos t di s turbingly, some groups presumed that almost any amplitude or AVO phenomenon was a direct hydrocarbon indicator. We used to call this “loop-level” seismic stratigraphy. With these lapses, a faniform amplitude became a fan, when it was actually the amplitude supported portion of a regional marl event. In another case a colleague was determined that any high amplitude on an unconformity was indicative of sand. Hmm… A regional marl again with varying porosity was the actual culprit. My work with instantaneous amplitude in the early 80’s and sub-regionally varying trends gave me the tools to avoid many such pitfalls. Too often I observed analyses that skipped key steps or observations that were absolutely necessary to anchor an interpretation. Some groups failed to do the necessary regional and sub-regional work to become familiar with a trend. Some groups did not routinely calibrate well data to seismic at the genetic level to learn where the potential reservoirs “lived” or how they were distributed laterally and/or downdip. Mos t di s turbingly, some groups presumed that almost any amplitude or AVO phenomenon was a direct hydrocarbon indicator. We used to call this “loop-level” seismic stratigraphy. With these lapses, a faniform amplitude became a fan, when it was actually the amplitude supported portion of a regional marl event. In another case a colleague was determined that any high amplitude on an unconformity was indicative of sand. Hmm… A regional marl again with varying porosity was the actual culprit. My work with instantaneous amplitude in the early 80’s and sub-regionally varying trends gave me the tools to avoid many such pitfalls.
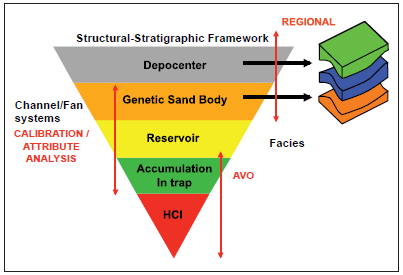 The latter tendency to start an analysis with an amplitude expression became so prevalent that I was moved to display Figure 2 as shown in Figure 3 when I was called forth with two other “contrarians” to speak to Arco Geoscience management in Plano on the integration of geology and geophysics. Perhaps now people would get the point that you cannot ‘base’ your interpretation on the head of a pyramid! The latter tendency to start an analysis with an amplitude expression became so prevalent that I was moved to display Figure 2 as shown in Figure 3 when I was called forth with two other “contrarians” to speak to Arco Geoscience management in Plano on the integration of geology and geophysics. Perhaps now people would get the point that you cannot ‘base’ your interpretation on the head of a pyramid!
Another envisioned method of describing the whole process came to me after I showed a co-worker geologist, who had become enamored of AVO, that I could deduce the same answers he had reached after study of five examples by simple and real-time observation of their seismic sections.
Figure 4 shows a drawing made at home of a telescope using my husband’s CAD drafting program. This was not the first time he had aided me with such a thing. Previously he had helped me make a base map from some intersections and scales from old seismic sections for a South American basin. The resulting map on these data thereafter turned out to be a perfect tie to a published map for the other half of the basin. Cool.
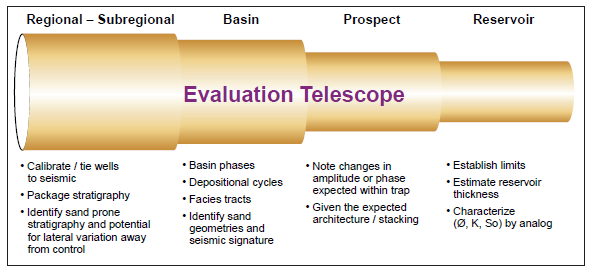
Here the intent is to show that the process needs to be a continuum of the stages of analysis (Figure 4). Different work is done at each of the stages and all of it fits comfortably within the work done in previous stages. The work stages need not be done in this particular order. Well calibrations may be done at the field / prospect scale, for example, in order to predict reservoir characteristics and distribution within the trap for reserve estimation.
Just as I was beginning to wonder how I might bring this column to a close, there was an occurrence yesterday in a prospect review meeting to assess what needed to be done. An individual made the stunning statement that he saw no difference between a sedimentologist and a seismic sequence stratigrapher. He said it was just semantics……
I would like to thank David Miller, a Statoil colleague, for standing in as our post-editor for December’s extended article by Potter and Szatmari and for this issue.
|