|
Interpreters will refer to thickening, thinning, pinchout, but not convergence, lap outs, and truncation. All of these former are descriptions that are based on amplitude data and the latter are made in the continuity domain. Akin to how “easy” kids have it today, now we can use redisplay techniques “on the fly.” When I started using them in 1982, the data transforms were done on a mainframe computer in a job that took 45 minutes to run. The processed data was saved to magnetic tape and its reel delivered across town. The tape was then mounted on a plotter and the data plotted; the whole process . would take at least 24 hours. Workstations and personal computers would not become mainstream for several more years.
In an interesting turn of events, and unbeknownst to me, one of my early, vividly colored sections across the Jurassic margin off New Jersey, was supplied to Versatec to advertise, in the AAPG Explorer July 1984, their first 42” color plotter. Either by accident or design to disguise the section’s distinctive location, it was held and being inspected upside down by the man in the ad!
Sometimes, rigor and logical thought-based conclusions are belittled by the “true explorationist” as so many “details”. To me, geoscience is investigative, and as such relies on clues — I call them es sent ial obser vat ions — that cons t rain the gamut of interpretations to the most likely ones. I never wanted to be an “arm-waving” geologist, who is also sometimes scorned. Is it any wonder that I am drawn to appraisal geology where there usually is a bit more data with which to work?
Unfortunately, there is a lot of lip service to the real integration of geology and geophysics and a real blurring of the disciplines (“geoscientists”) sometimes these days without adequate, thoughtful cross training. In order to master the description of reservoir facies architecture in context, one might want to appreciate the ambiguity of amplitude illustration and question interpretations made solely on black and white sections.
I want to describe some applications of a largely “missing” albeit direct technology that promotes an integrated approach. A few simple techniques can help an interpreter maximize the utilization of seismic and well data for which our companies pay so dearly, can help individuals build confidence and build visible experience. These techniques also provide a robust reservoir characterization framework (saved for a later column?). Within this framework, seismic signatures and pressure variations can be placed in predictive stratigraphic contexts. More than anything, these techniques have led to some improved seismic stratigraphic, reservoir, and geologic models.
I plan to share a half dozen line drawing examples from “somewhere” in Mississippi Canyon as illustrations of what can be achieved so easily and quickly with a little thought and logic. In each of these drawings, the colored line represents soft-trough reservoir sands, black lines indicate peaks. Some of the figures are mere sketches from memory, others were originally cartoons drawn directly from seismic.
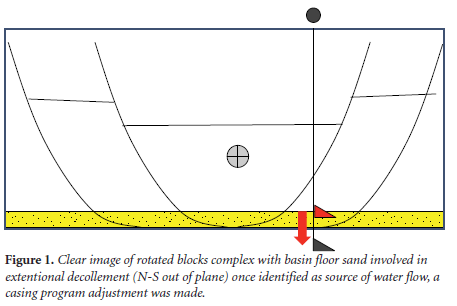
In the first example, wells experienced a water flow. Research geologists believed the feature involved was a large channel system. A simple redisplay revealed the presence of a rotated blocks complex whose decollement surface soled into water-wet, basin floor fan sands (Figure 1). One look at the redisplay of the seismic data was all the engineers needed to see to correct the casing design. By the time the “cavalry” came to call, the hubbub was all long over. Our geophysical manager later suggested that we not “confuse” the production department with this “new” seismic. Well that horse had already left the barn too, as the geological engineer thanked me for giving him a tool that also made his job of describing the extent all of his reservoirs doable.
After viewing seismic image li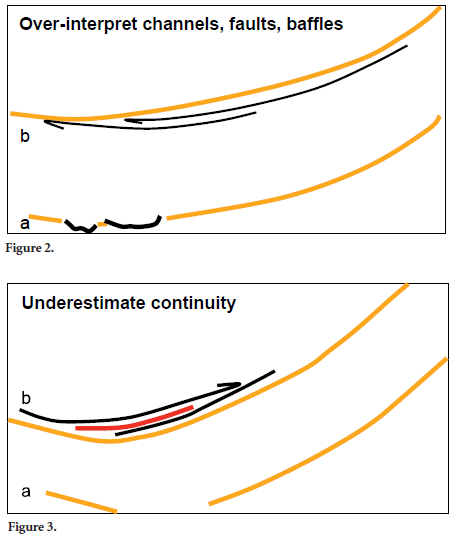 mitations and interpreted discontinuities on several of the mapped pay horizons, it seemed advisable to see if certain tacit assumptions bore up under scrutiny with an emphasis on better continuity. Little did I know what we would learn! mitations and interpreted discontinuities on several of the mapped pay horizons, it seemed advisable to see if certain tacit assumptions bore up under scrutiny with an emphasis on better continuity. Little did I know what we would learn!
Dim out discontinuities evident in vertical section across one of the thickest pay zones were considered to be evidence of channel cuts (Figure 2a). Such an interpretation carried with it numerous implications that were largely unexamined. The interpretation seemed to be confirmed in horizontal section that showed a sinuous pattern to the dim. However, redisplay revealed that the dims were actually caused by negative inter ference of mul t iple cycles of t runcat ion terminations beneath the basin floor fan sand (Figure 2b). The sinuous pattern of dim in horizontal section was simply the trace of the termination edge of the basin supported by salt. The presence of a continuous thick, continuous reservoir was a very positive bit of news. The s e te chnique s c an a id in the conf i rmed interpretation of channels, faults and other baffles to hydrocarbons, and better yet, determine when they are not the issue.
At the same reservoir level, another amplitude discontinuity was observed in the syncline (Figure 3a). The reservoir was strongly amplitude supported on either side below the tested lowest known oil (LKO). An elaborate “model” was proposed for this observation that included improbable large erosive currents scouring out the 125-150 foot sand body. Instead, what was revealed by redisplay, was that the sand body was completely continuous through the syncline, and a fill package with a peak-trough-peak signature directly overlay the dim out (Figure 3b). This subsequent cycle could be construed to be the cause of the negative interference. The implication of this simple finding was, in this case, that the reservoir could likely be filled through the syncline!
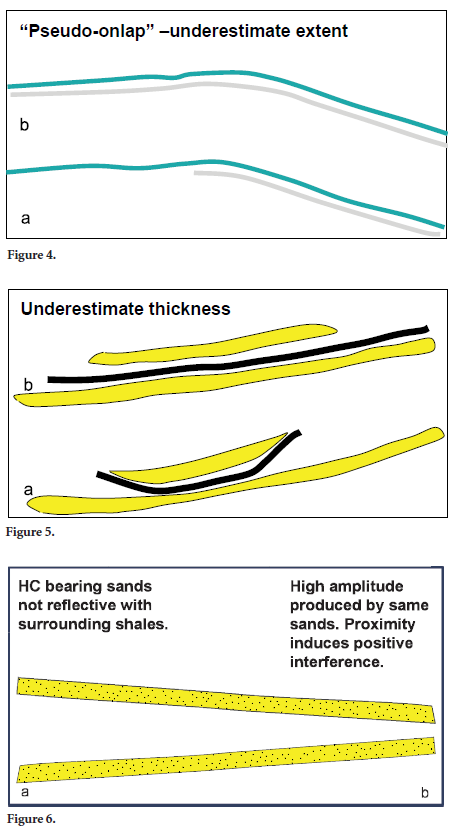
In another case, well control showed that two relatively thin pay sands were present, but only one could be mapped to its full extent. Redisplay showed the distinctly individual sands. What had occurred was called “pseudo-onlap” by Schlager some five years after this observation. In the amplitude domain, the two similar sands approached a critical convergence spacing and produced unnatural and sudden “adhesion” geometry without any other obvious interference phenomena (Figure 4a). With redisplay, the distinct extents, thickness, and reserves of both reservoir sands could be characterized (Figure 4b).
Example number five involved the predicted outcome of an appraisal well. The conventional wisdom was that the well would encounter possible thick channel sand cut into a lower lobe sand (Figure 5a). An observation that seemed to support this interpretation was that the wiggle trace for the lower unit was thin. Upon redisplay, it could be shown that these two depositional units did not interfere in time and space at all (Figure 5b). Moreover, the upper and lower sand were both then predicted to be thi cke r than e i the r had be en encountered before and that is what the appraisal well found. Also the upper sand did not have the aspect of a channel so much as a slightly more restricted in area lobe sand.
The final example comes from the deepest of the illustrated cases. Two sands, oft-called “suitcase“ or “twin” sands, were also encountered in wells that were drilled updip under the salt, where their extent was not originally imaged. Alike in many of their petrophysical properties, imaging was also hampered by the fact that the two attractive hydrocarbon bearing reservoirs were not reflective against their surrounding shales. At the correlative location to the upper sand near the center of its depositional basin, there was a large very bright amplitude signature. Our geophysical manager’s opinion was that that was where this reservoir’s properties got “better.” Given that these were the coarsest grained, cleanest sands ever, it was hard to imagine. At redisplay, not only was it possible to map both sands well up to their eventual trap under salt (Figure 6a), but the sands weren’t twins at all in the sense that they were discordant. The high amplitude event was caused by the two sands coming into closer proximity elsewhere in the basin and “turning each other on” so to speak (Figure 6b). I have seen this phenomenon elsewhere in the GoM, notably Ewing Bank.
Curiously, though this work added tens of millions of barrels of hydrocarbons to our booked resource, there was no management audience for this work — or for the next Special Project solution that my team made in record time for that matter. There is something sad about that. This is how we can lose our way.
|