|
First of all, Bob showed the audience that average temperature profiles differed slightly by reporting agency, NASA (Hansen), NOAA, Hadley (Climate Research Unit of East Anglia University). All have similar, but different temperature curves. Moreover, the data reported by a given agency are sometimes changed and most of the data sets on which climate change predictions are based had been either deliberately altered to show a w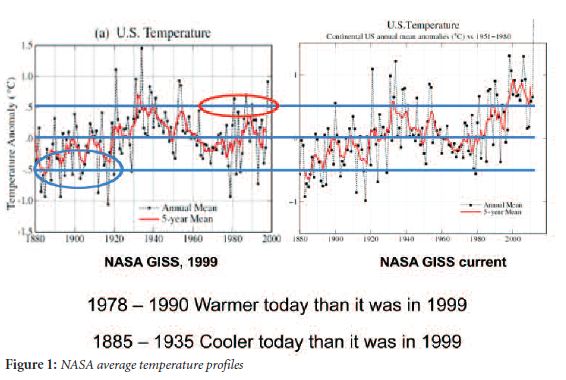 arming bias or have had a warming bias introduced through the collection, homogenization, and processing of the data. arming bias or have had a warming bias introduced through the collection, homogenization, and processing of the data.
Of NASA’s five proclaimed warmest years over the last century it was supported by for only a third of the raw data in 2008. In fact, while a third of the stations are clearly warming since 1970, a third of the stations’ records are flat, and a third show cooling since 1970. This distribution can no longer be confirmed, however, as many of the temperature records in the NASA GISS data base (http://data.giss.nasa.gov/gistemp/station_data/) have been altered between 2008 and 2012 (Figure 1).
Another question Bob raised is “What do average temperatures really mean?” Well that depends on where the actual stations are. Actual station temperatures can vary widely even when in relatively close proximity, with some profiles showing warming trends and others showing cooling trends.
Question 1: What are temperatures actually doing?
Bob’s first answer was that global temperatures are changing. This was not a facetious answer; global temperatures can be shown to change cyclically, with a number of wavelengths and amplitudes.
- Over 100’s of millions of years, the cycles have a wavelength of 150- 200 million years and amplitude of ~15°C.
- Over tens of millions of years, the cycles have a wavelength of 15-20 million years and amplitude of ~4°C.
- Over a period of hundreds of thousands of years, the cycles have a wavelength of 100 thousand years and amplitude of ~10°C. At this scale it becomes apparent that the current “global warming” trend started 15,000 years ago and therefore could not be caused by humans.
- Climate cycles of hundreds of years have a wavelength of 600-700 years and an amplitude range of ~0.6°C to ~0.8°C • Climate cycles of tens of years have a wavelength of 30-40 years and an amplitude range of ~0.5°C to ~0.6°C
- Climate cycles of a few years have a wavelength of 3-5 years and an amplitude range of ~0.3°C to ~0.4°C.
So he had to advance a corollary question 1A: “How much have Global temperatures changed?” The answer depends on the reference point one chooses.
- We have warmed ~8°C since the Pre-Cambrian;
- And cooled ~8°C from the Eocene to today.
- If you change the reference point to the end of the Pleistocene, we have been warming except for the last 10,000 years that we have been cooling!
- If we change the reference point to the Roman Warm, approximately 2000 years ago, we have been gradually cooling.
We have been warming since the end of the 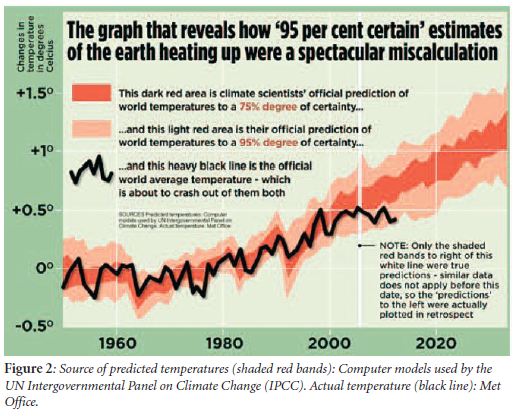 “Little Ice Age” in 1820. So how much has temperature changed? “Little Ice Age” in 1820. So how much has temperature changed?
- We have warmed ~0.8°C for 1919 to 1998 or about 0.009°C per year. That amount of warming is neither abnormal nor unprecedented. Most temperature stations show more than 0.8°C annual variation!
- A graph of UAH Satellite-based temperature of the global lower atmosphere from 1979 to present shows that temperatures have been constant to cooling from 1998 to Present.
What is causing temperatures to do what they are doing?
The Intergovernmental Panel on Climate Change (IPCC) was established in 1988. Its aim it is to demonstrate a human-cause to climate change as a means of promoting the UN’s Agenda 21 state that “globally averaged temperatures have increased since the mid- 20th century due to anthropogenic (man-made) greenhouse gas concentrations”. Stated another way, humans are causing global warming, principally through their use of fossil fuels.
Just because the rise of CO2 emissions associated with fossil fuel use correlates to increased temperature, does not mean it is the cause; correlation does not imply causation. There are many flaws in the hypothesis that CO2 is the cause of Global warming. Here are a few.
- The first flaw in this logic is that earth is not a closed system. Constant earth temperatures would require “Radiative Energy Balance”; that is, the amount of incoming sunlight would have to exactly equal the emitted infrared radiation. Although greenhouse gases do affect the amount of infrared radiation back into space, the system is not closed.
- The second flaw is the signature of increased greenhouse effect would result in a hot spot 10 kilometers in the atmosphere over the tropics. Radiosonde data show no such hot spot.
- Flaw three is that CO2 is not a pollutant. Plants, trees and algae all need CO2 and recent studies show that increased CO2 levels are beneficial to the biosphere. One tree over 100 years will absorb 1100 kg of CO2 from the atmosphere. Plants that grow the fastest (weeds?) or produce the most biomass consume
 the most CO2. The CO2 turnover may be 45% higher than thought. So if you are worried about CO2, help plant some trees. Go to the National Forest websites, become a reforestation volunteer, or help reforest Colorado. Reforestation of damaged rainforests is more efficient at carbon capture than softwood monoculture plantations. the most CO2. The CO2 turnover may be 45% higher than thought. So if you are worried about CO2, help plant some trees. Go to the National Forest websites, become a reforestation volunteer, or help reforest Colorado. Reforestation of damaged rainforests is more efficient at carbon capture than softwood monoculture plantations.
- Flaw four is that CO2 levels are 380 ppm at present, which is highly diluted. If you drank 380 gallons of scotch, it would be lethal, unless it was mixed with a million gallons of water!
- Flaw five notes that water vapor is the most significant greenhouse gas and it is not included in climate models.
- Flaw six centers on the fact that temperature increases cause CO2 increases, not the other way around; therfore CO2 increases cannot be the cause of global warming.
- The final and fatal flaw pointed in Bob’s thorough and logical presentation was that a molecule of human caused CO2 is identical to a molecule of naturally-caused CO2. A chart of the Total Atmospheric CO2 from 1800 through 1960 shows that total atmospheric CO2 levels have decreased from the 1800’s.
Bob paused at this point to ask that if CO2 does not cause global warming, can the atmospheric concentration of CO2 become so great as to create a “tipping point” such that CO2 impacts global temperatures? The answer to this question was “Absolutely – in theory”. But does it?
There are two slope changes in the plot of human-caused CO2 one at ~1890 and a second one at ~1950. The NOAA Global Mean Temperatures chart shows slight temperature increases 4 to 6 years after those slope changes in the human-caused CO2. It should be noted, however, that these two possible CO2 effects on temperature are only small perturbations in the overall temperature cycles.
At this point Bob directed our attention to solar activity. Solar flare activity wa high in the periods between 1973 and 1984, 1987 and 1993, and between 1997 and 2002. All periods of high solar flare activity show a corresponding temperature increase. So may there be a cosmic ray climate link? Well, ions associated with cosmic rays influence cloud formation. Harken back to the statement made earlier that “that water vapor is the most significant greenhouse gas and it is not included in climate models”. The data from 1850 to 2000 (NOAA’s Global Mean Temperatures chart) show 20-30 year cycles in temperature – cooling from 1880-1910 and from 1940-70 and warming from 1850-80, 1910-40 and from 1970-2000 close to the current climate “crisis”.
The cause of the 20-30 year cycles is, at least in part, the Pacific Decadal Oscillation or PDO. PDO also influences the El Nino Southern Oscillation (ENSO) and ENSO affects on global climate is well documented. The high temperatures observed in the years 1982, 1987, 1991, 1992, 1995, 1998 (?), 2001, 2007, 2010, and 2012 can be related to ENSO events. So, in conclusion for the 2nd question “What is causing temperatures to do what they are doing?” Temperature data reflect strong control by solar activity, a strong effect by oceanic currents, and a possible weak effect of CO2.
So, what will temperatures do?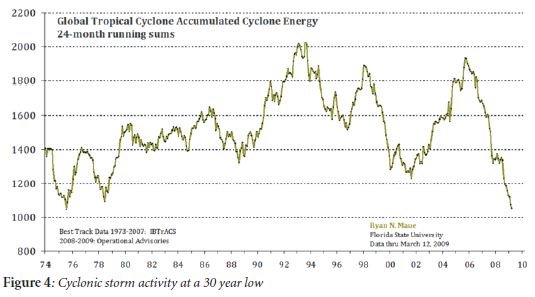
Temperatures will continue to change in multiple cycles of varying wavelength and amplitude and those changes will happen no matter what anyone says or does.
The IPCC prediction that world temperatures could be raised by 1.1- 6.4°C (i.e., 2- 11.5 °F) has been shown to be grossly inaccurate, as current temperatures fall below the predicted IPCC 95% confidence-level prediction (Figure 2).
It is important to recall that their predictions are model-based and that many of the assumptions in their current model are incorrect. Since 1998 temperatures have been flat to cooling in spite of increased CO2 levels.
Fundamentally we do not know exactly what temperatures will do, but the PDO has shifted to a cool phase and solar flare activity is at very low levels – together these suggest a prolonged period of cooling.
Just what are the consequences of climate change?
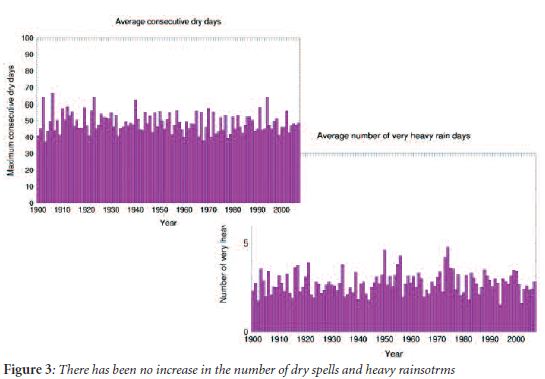
The doomsayers have predicted that the Nile will shrink, the Sahara desert will expand and civilizations in North Africa and the Middle East will collapse due to major drought. IPCC says that sea levels will probably rise by 18 to 59 cm (7.08 to 23.22 inches). They cite a >90% confidence level that there will be more frequent warm spells, heat waves, and heavy rainfall. And they cite a >66% confidence level that there will be an increase in droughts, tropical cyclones, and extreme high tides. There has been no increase in the number of dry spells and heavy rainstorms in the period 1900 to 2000 (Figure 3). There has been no increase in maximum hurricane wind speeds or the number of violent Atlantic hurricanes. In fact cyclonic storm activity is at a 30 year low (Figure 4). Sea level increases are following a 150- year trend of a seven inch per century rise from 1850-2000, completely insensitive to when hydrocarbon use increased post-WWII. At this rate IPCC’s prediction will be realized in the year 3000. If cooling continues, sea level will drop.
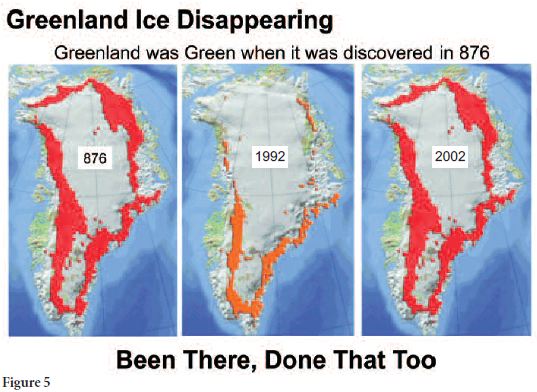
Things that make the headlines, such as retreat of the Greenland and other glaciers, are often noted out of context. Glaciers have been shrinking on a 180 year trend, since well before the advent of industrialization. Greenland was green in the year it was discovered too - 876 A.D. In 1992 the ice cover was greater than it was in 2002 (Figure 5).
Arctic ice was deemed to be melting in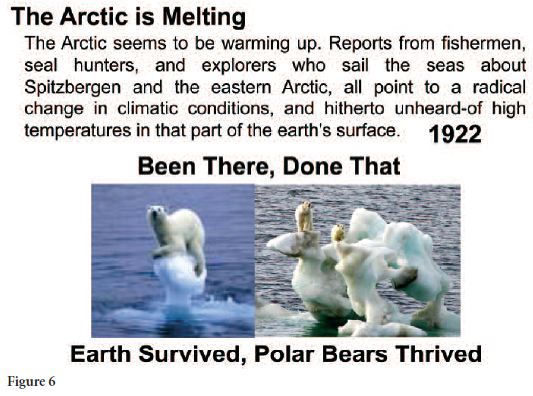 1979; by 1999 and 2008 it was back with a vengeance. Similar dire predictions and scary photos were shown of shrinking habitat for polar bears in 1922 (Figure 6). Guess what? The polar bears are still with us and so is Arctic ice. 1979; by 1999 and 2008 it was back with a vengeance. Similar dire predictions and scary photos were shown of shrinking habitat for polar bears in 1922 (Figure 6). Guess what? The polar bears are still with us and so is Arctic ice.
Glacial retreat can be documented in pictures of Mount Kilimanjaro in 1970 to 2000 (Figure 7). But in 2008, the ice cover was greater than ever. Modern satellite data shows that Asian glaciers are actually growing, not shrinking.
So is there any real crisis at present or is everything about global warming alarmist hype? Well if everything that “correlated” with the rise in the Global Temperatures Index, then the Federal debt is also “caused” by global warming!
To summarize:
- A historical rate of 0.07 inches per year is not a catastrophic rate of sea level rise, nor is it unprecedented – and it may go down as glacial forces resume during cooling.
- There are no more droughts or storms than normal.
- Ice melting is normal for interglacial periods.
- CO2 is not the cause of global warming. Rather, temperature increases cause CO2 increases. CO2 may be high enough to impact climate.
- Solar flare activity has a stronger impact on climate than CO2.
- Changes in oceanic circulation have a stronger impact than CO2.
- Based on global averages, temperatures increased 0.8°C from the 1800’s to1998; from 1998 to present, the temperature trend has been essentially flat.
- Low solar activity levels combined with the PDO in a cool phase suggest we may be in for a period of cooling, perhaps similar in scale to the last “Little Ice Age”.
So what can we learn from history ab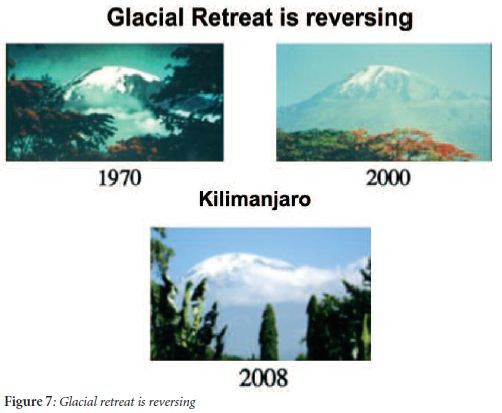 out the consequences of global warming: out the consequences of global warming:
- Recall the Roman Empire prospered during the Roman Warm from 25 to 200 A.D as globally warmer temperatures allowed for prosperity and food surpluses.
- The crisis of the third century occurred during a period of global cooling which shortened growing seasons and reduced crop yields.
- The age of the Viking Exploration AD 793- 1066 and the Renaissance AD 1300-1600 occurred during warming phases, again facilitated by crop surpluses.
- The Little Ice Age, from 1550-1850,was a time of hunger and famine, which in turn drove colonial expansion of the European powers seeking to maintain their prosperity.
Human kind seems to do better when it is warmer so does it make sense to fear it and to spend billions of dollars to see if we can make it colder?
|
 What are Global Temperatures Doing and Why are They Doing It?